During the inaugural 1946 NBA season, the highest-earning player in the league was Tom King of the Detroit Falcons with a yearly salary of $16,500. The reason he was the highest paid player in the league? He got paid for being a player as well as the teams business manager AND publicity director!
Since then, things have changed drastically. Salaries in the NBA had been rising steadily for decades, but the last TV deal in 2016 supercharged this development and increased salaries by over 60% within only 3 years.
It's fair to say, that NBA players don't have to worry about feeding their family, but just how rich are they really? Let's find out!
How much do NBA players make?
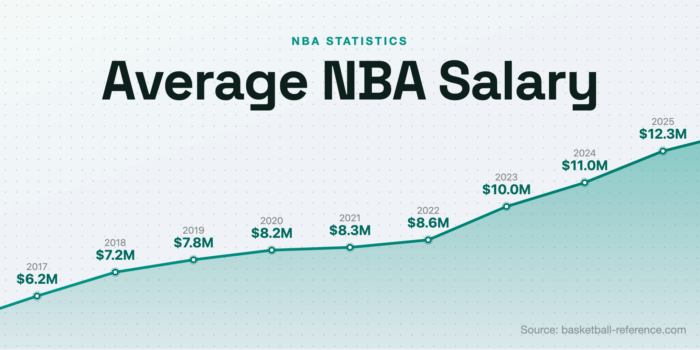
The average NBA salary in 2025-2026 is $13.2M.
For this analysis I used data from basketball-reference.com. Salary data is not officially reported by the NBA, so these numbers might not be 100% accurate, but they should be close enough to give a very good idea of the evolution of NBA salaries. To clean up the data I removed 10-day players and two-way contracts and only looked at players earning at least the relevant minimum salary.
We can see that the average salary during the 1990-91 season was just below $1M and has grown by over 15x since then to around $13.2M in 2025-26.
From 1991 to 2009 the average salary grew consistently before hitting a rough spot following the '08 Financial Crisis and the subsequent new collective bargaining agreement in 2011 that lowered player salaries from 57% of basketball related income to around 50%.
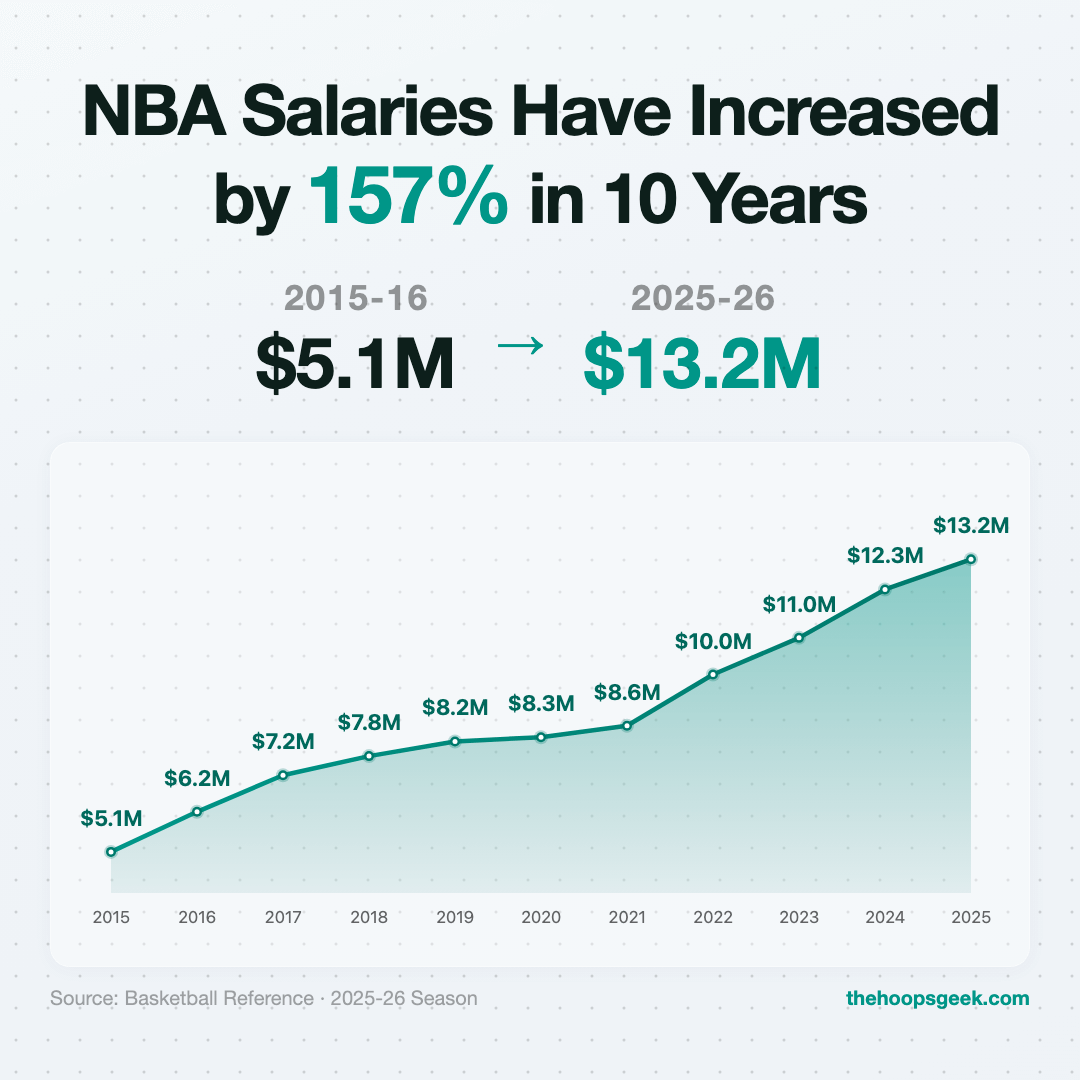
Before the 2016-17 season the NBA signed a new TV deal with ESPN and Turner Sports worth roughly $2.6B a year (up nearly 200% from the previous deal) and we can see the explosion of salaries after the deal was signed. Average NBA salary grew from $5.1M in 2015-16 to $7.8M in only 3 years!
From 2019-20 to 2021-22 salary growth slowed significantly, with the average only creeping up from $8.2M to $8.6M over three seasons, a result of revenue losses during the Covid pandemic.
After the pandemic, salaries exploded again. The average jumped from $8.6M in 2021-22 to $10M in 2022-23 as NBA revenues recovered and a new collective bargaining agreement was signed in 2023. Growth continued to $11M in 2023-24 and $12.3M in 2024-25, marking the steepest four-year climb in NBA history.
The 2025-26 season marks the start of the NBA's massive new media rights deal with Disney (ESPN/ABC), NBCUniversal, and Amazon Prime Video, worth approximately $76B over 11 years (~$6.9B per year), nearly tripling the value of the previous $2.6B/year deal. With the average salary now at $13.2M and the full impact of this deal still to play out, we can expect salaries to keep climbing in the years ahead.
Average NBA Salary by Position
Taking a look at salary by position it's interesting to see that from 1990-2000 Center was the highest paid position every year. Dominant big guys like Patrick Ewing, Shaq, Alonzo Mourning or David Robinson are among the most expensive players during this period.
From 2000, power forwards take over the top spots but we can still observe a clear trend where big guys are consistently paid better than other positions.
This changed around 2020 when point guards became the best paid players in the NBA, and the gap has only widened since.
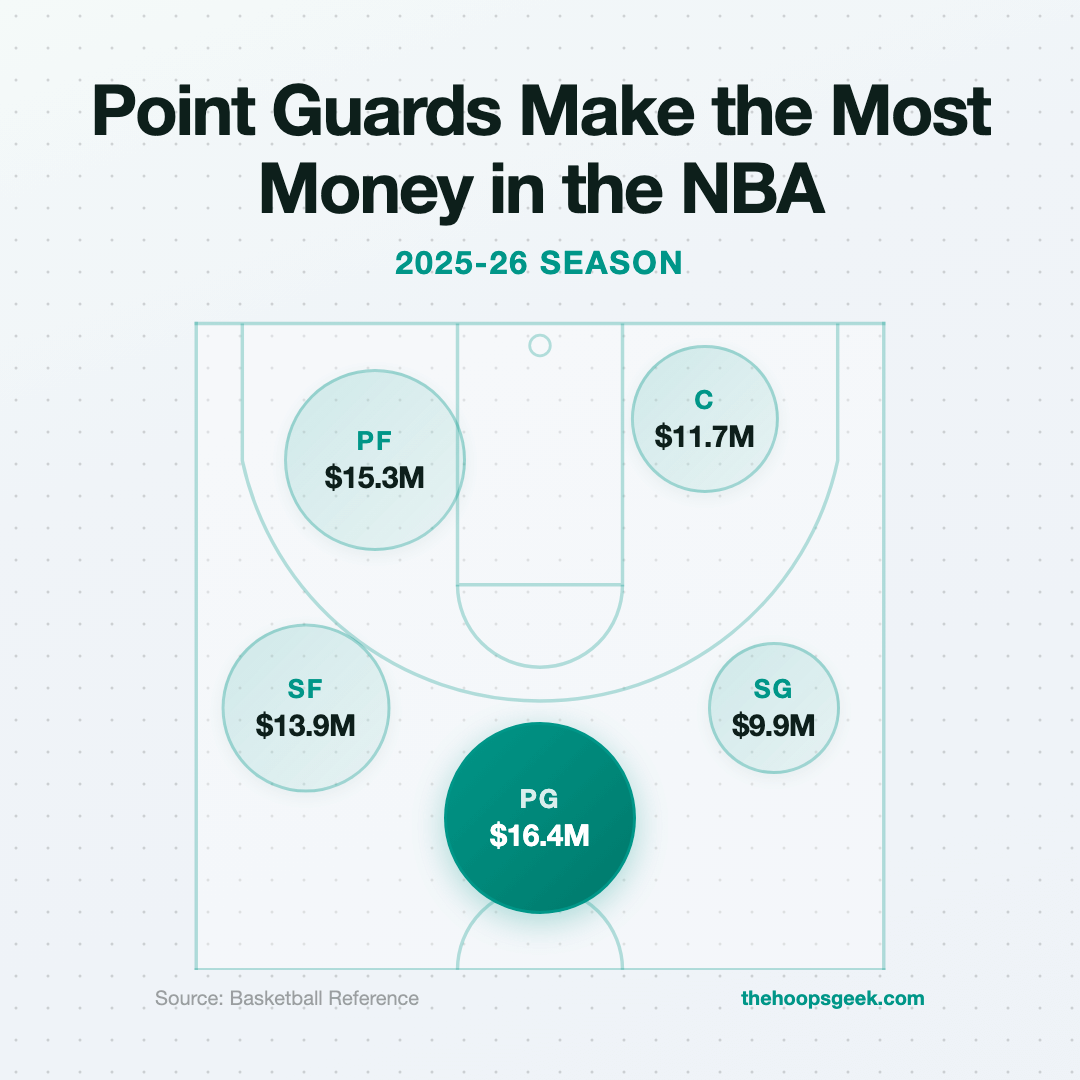
In 2025-26, point guards earn an average of $16.4M, well ahead of power forwards at $15.3M and small forwards at $13.9M. Steph Curry leads the way at nearly $60M, making him the highest paid player in the league, while other top point guards like Luka Doncic, Cade Cunningham and Trae Young all earn over $45M.
Meanwhile, shooting guards remain the lowest paid position at just $9.9M, earning less than half of what the average point guard makes. The era of the ball-dominant, max-contract point guard has fundamentally reshaped the NBA's salary landscape.
Table 1: Average Salary in the NBA by Pos:
| Year | Average Salary | PG | SG | SF | PF | C |
|---|---|---|---|---|---|---|
| 2026 | $13.2M | $16.4M | $9.9M | $13.9M | $15.3M | $11.7M |
| 2025 | $12.3M | $15.8M | $9.6M | $11.9M | $14M | $11.7M |
| 2024 | $11M | $14.1M | $9.7M | $9.6M | $12M | $9.9M |
| 2023 | $10M | $13.4M | $8.8M | $10.1M | $9.6M | $8.9M |
| 2022 | $8.6M | $12.4M | $7.2M | $7.3M | $9M | $7.8M |
| 2021 | $8.3M | $11.5M | $6.8M | $7.9M | $8.3M | $7.6M |
| 2020 | $8.2M | $10.8M | $6.9M | $8.4M | $7.5M | $7.8M |
| 2019 | $7.8M | $8.1M | $6.6M | $8.1M | $7.9M | $8.5M |
| 2018 | $7.2M | $7.4M | $7M | $7M | $7.3M | $7.5M |
| 2017 | $6.2M | $6.3M | $5.5M | $6.3M | $6.4M | $6.7M |
| 2016 | $5.1M | $5.3M | $4.1M | $5.6M | $5.2M | $5.5M |
| 2015 | $4.8M | $4.6M | $4.1M | $4.6M | $5.2M | $5.4M |
| 2014 | $4.9M | $4.6M | $4.2M | $4.7M | $5.4M | $5.7M |
| 2013 | $4.8M | $4.2M | $4.3M | $4.3M | $5.6M | $5.4M |
| 2012 | $4.7M | $3.9M | $4.7M | $4.9M | $4.5M | $5.4M |
| 2011 | $4.7M | $4.2M | $5M | $4.7M | $4.8M | $4.9M |
| 2010 | $4.9M | $4.1M | $5.3M | $4.5M | $5M | $5.5M |
| 2009 | $4.9M | $4.4M | $5M | $4.8M | $5M | $5.3M |
| 2008 | $4.6M | $4.4M | $4.3M | $4.7M | $4.8M | $5M |
| 2007 | $4.3M | $3.6M | $4.2M | $4.8M | $4.1M | $4.7M |
| 2006 | $4.2M | $3.5M | $4.6M | $4.3M | $4.7M | $4.1M |
| 2005 | $3.9M | $3.3M | $3.6M | $4M | $5.1M | $3.8M |
| 2004 | $3.9M | $3.1M | $4.2M | $3.7M | $4.4M | $3.9M |
| 2003 | $3.9M | $3M | $3.8M | $3.6M | $4.6M | $4.2M |
| 2002 | $3.5M | $2.9M | $3.4M | $3.5M | $4.2M | $3.6M |
| 2001 | $3.4M | $2.7M | $3.6M | $2.8M | $3.9M | $3.8M |
| 2000 | $2.9M | $2.5M | $2.7M | $2.5M | $3.3M | $3.5M |
| 1999 | $2.5M | $2.1M | $2M | $2.5M | $2.8M | $3M |
| 1998 | $2.2M | $1.9M | $2.4M | $1.9M | $2.1M | $2.5M |
| 1997 | $2M | $1.8M | $2.2M | $1.8M | $2.1M | $2.1M |
| 1996 | $1.7M | $1.7M | $1.5M | $1.6M | $1.8M | $1.8M |
| 1995 | $1.5M | $1.4M | $1.4M | $1.6M | $1.4M | $1.6M |
| 1994 | $1.3M | $1.1M | $1.3M | $1.3M | $1.4M | $1.4M |
| 1993 | $1.1M | $0.9M | $1M | $1M | $1.2M | $1.4M |
| 1992 | $1M | $0.8M | $0.9M | $1M | $1M | $1.1M |
| 1991 | $0.8M | $0.8M | $0.8M | $0.8M | $0.8M | $1.1M |
How Much Do NBA Starters and Bench Players Make?
Graph 3: Average Salary in the NBA by Starters / Bench Players:
In 2025-26, NBA bench players make on average $6.7M while starters make $21M.
For this analysis, I defined bench players as players who started less than half of their games and starters as players that started more than half of their games.
Unsurprisingly, starters have always earned more than bench players, but the gap widened sharply during the Covid pandemic. In 2019, starters made about 2.3x compared to bench players. By 2020-21 this had jumped to over 3x, as bench player salaries actually dropped while starter salaries continued to rise.
Since then the ratio has stabilized at around 3x, but the absolute dollar gap keeps growing, starters now out-earn bench players by $14.3M per year, up from $10M just four years ago.
Distribution of Salaries in the NBA
Graph 4: Interactive Chart of # of Players per Salary Bucket per Year
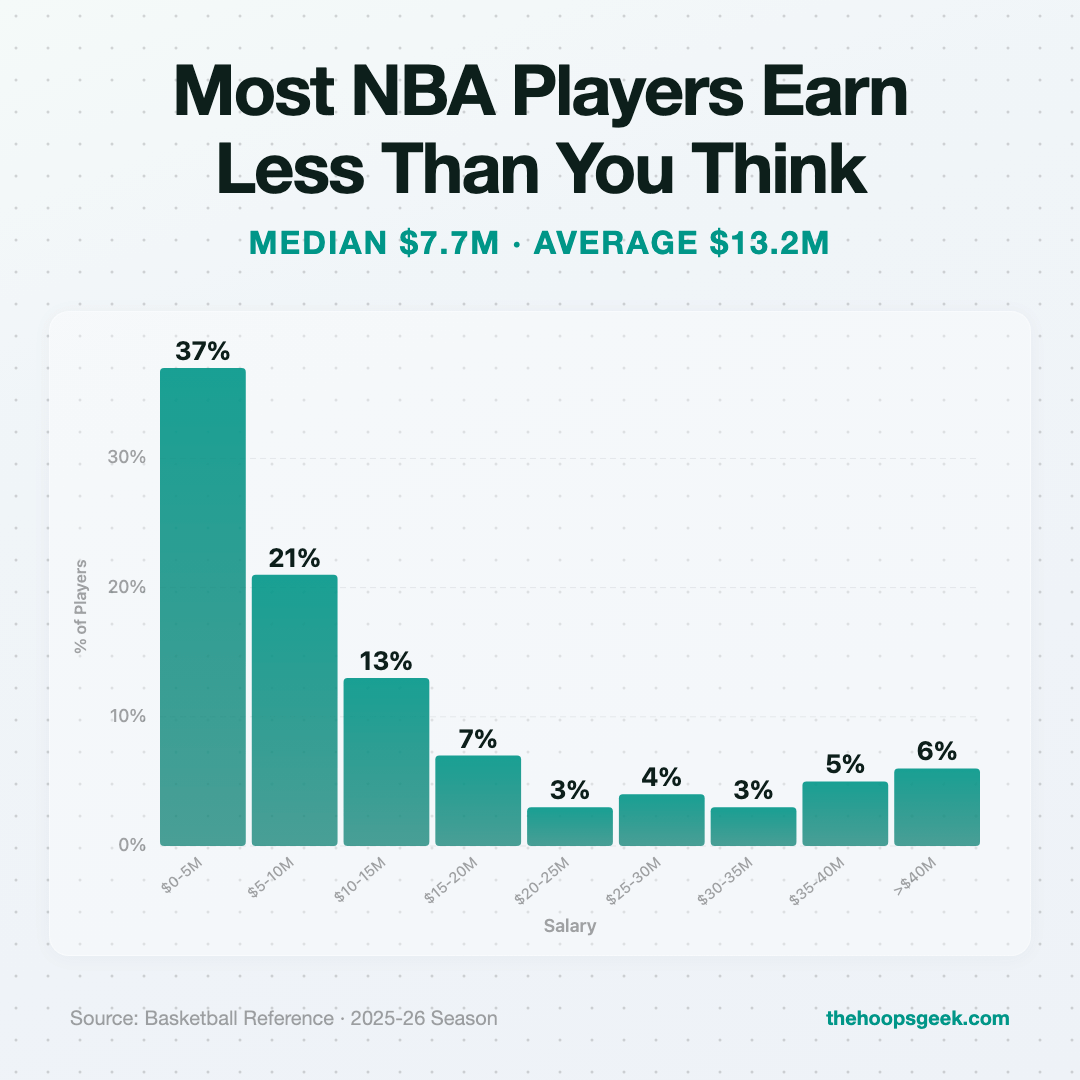
An average salary of $13.2M sounds amazing, but the salaries of NBA players are not distributed evenly at all. In 2025-26, 14 players make more than $50M in yearly salary (led by Steph Curry at nearly $60M, followed by stars like Jokic, Embiid, Durant and Giannis all above $54M) while 99 players — nearly a quarter of the league — make less than $3M.
The median salary in 2025-26 is $7,653,855, that means that 50% of NBA players make less than $7.65M. So the average salary is heavily skewed by a few players making insane amounts of money, while most of the NBA makes much less.
Another way to measure the inequality of the distribution of salaries is the Gini coefficient. It's a number between 0 and 1, where 0 shows a perfectly equal population (so every NBA player would make the exact same amount) and numbers close to 1 show a very unequal society (LeBron James makes $1B and the rest plays for free).
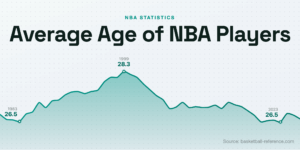
NBA Salaries by Player Age
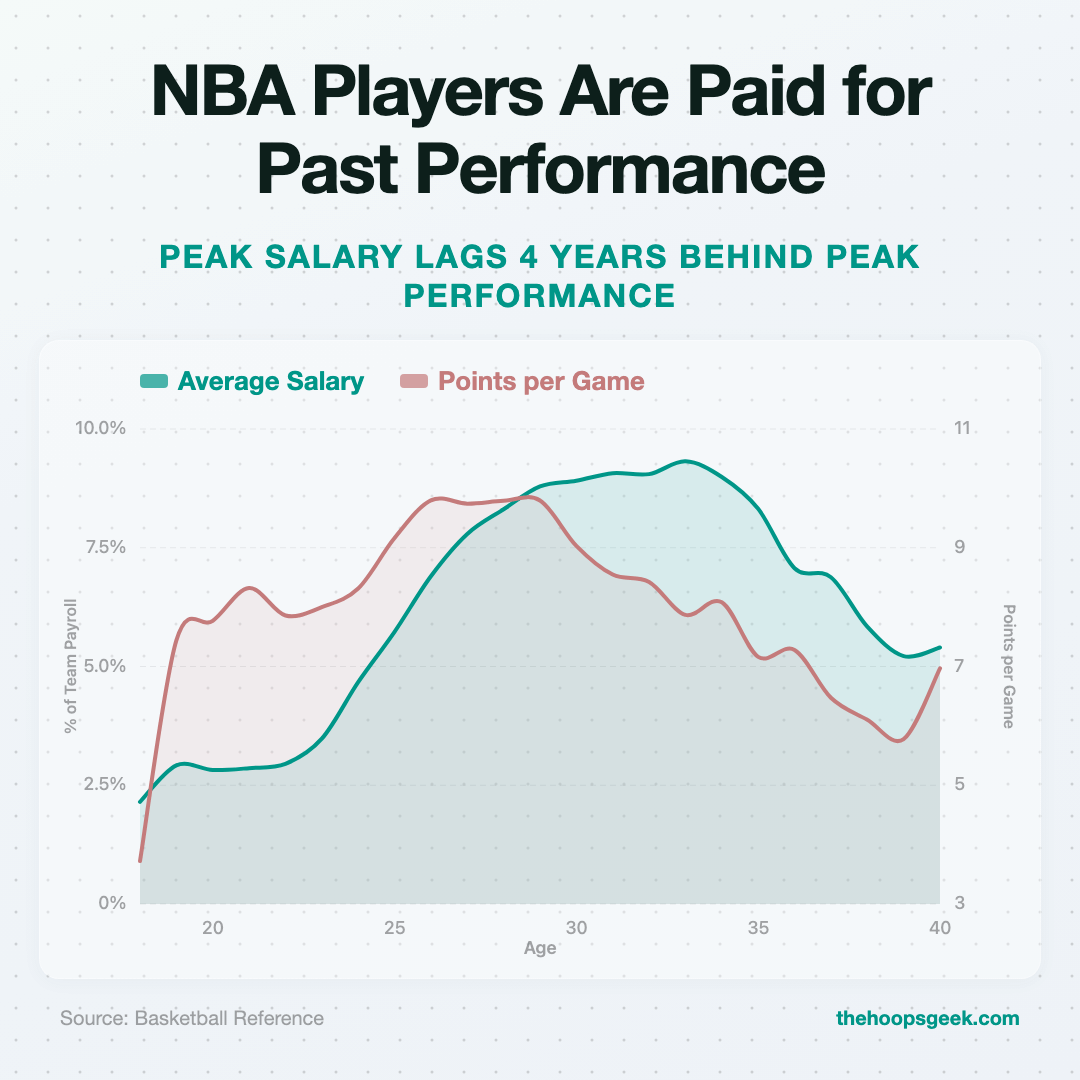
Going through the raw numbers of the data I collected I thought it would be interesting to take a look at salaries vs production of NBA players. You often hear that NBA players are paid for past performance, not necessarily how good they are right now.
Is this really the case?
Graph 5: Average Salary and PPG by Age in the NBA
From the graph we can see that points per game production peaks between the ages of 26 and 29 while salary peaks much later at 33.
The shape of both lines are very similar but salary correlates best with the production 4 years prior. So mathematically speaking, NBA players get paid according to past production roughly 4 years ago.
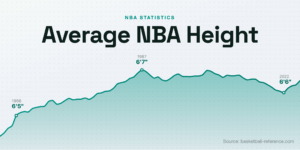
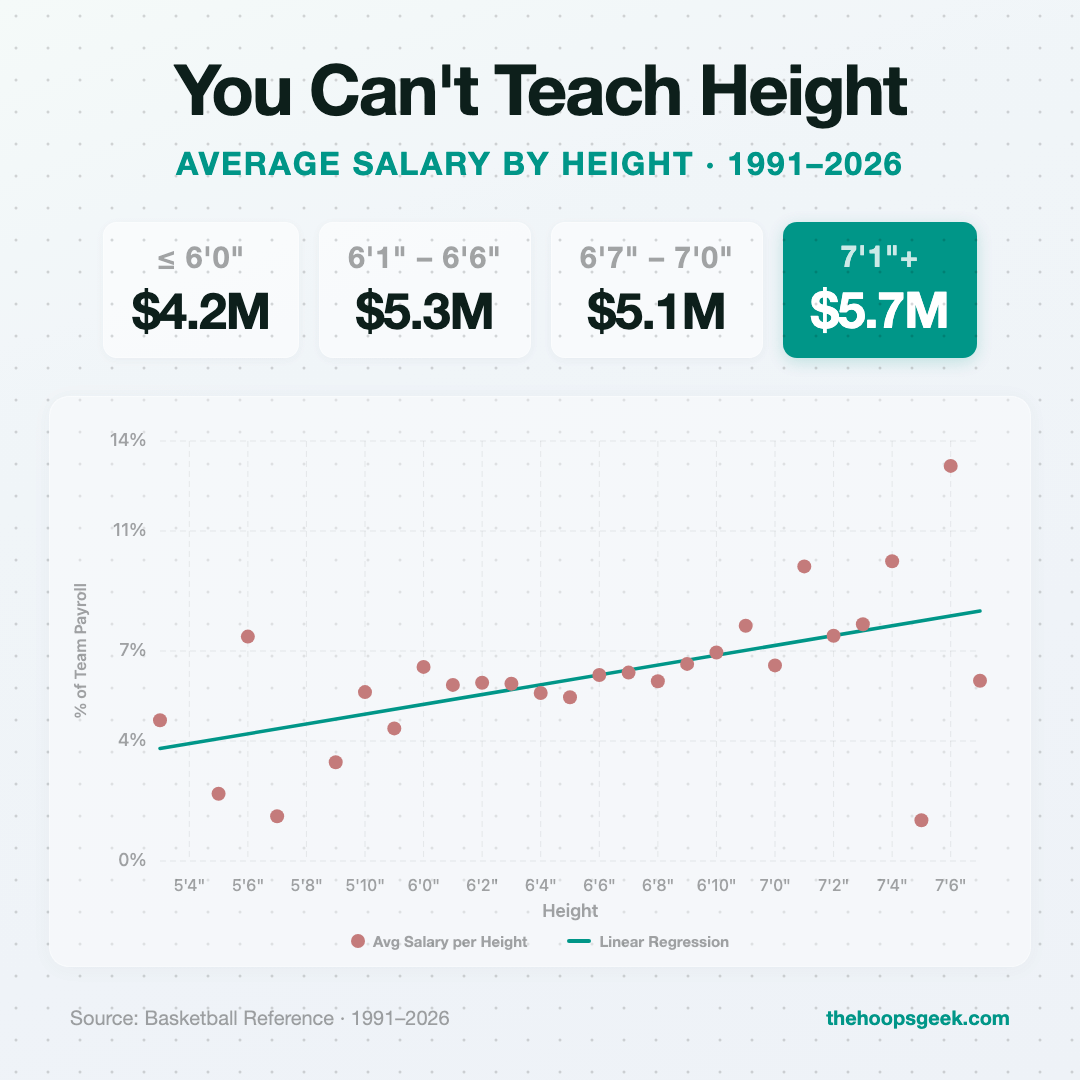
NBA Salary by Player Height
There is an old saying in basketball: "You can't teach height". That made me wonder whether big players are actually paid more since they are harder to come by than 6ft point guards?
Salary by Size:
The scatter chart shows that there is no perfect correlation between size and average salary but we can definitely observer a trend were taller players are paid more on average than smaller players.
Between 1990 and 2026 and filtering for heights with at least 100 player-seasons, players at 5'11 (DJ Augustin, Ty Lawson) were the cheapest while players at 7'1 (Shaq O Neal, Rudy Gobert etc.) where the most expensive.
NBA Salary Infographics
Final Thoughts
For this article I gathered a lot of information on stats and salaries from basketballreference.com and cleaned it to allow for easy analysis.
Is there anything interesting that I missed? Let me know in the comments and I'll add it to the article!

Founder of thehoopsgeek.com. A passionate basketball enthusiast and coding geek, Andy combines a love for sports with technology.